 MicroURL
All guides
Understanding your analytics
Every link is tracked automatically — no setup required. Here's what each part of the analytics view means.
1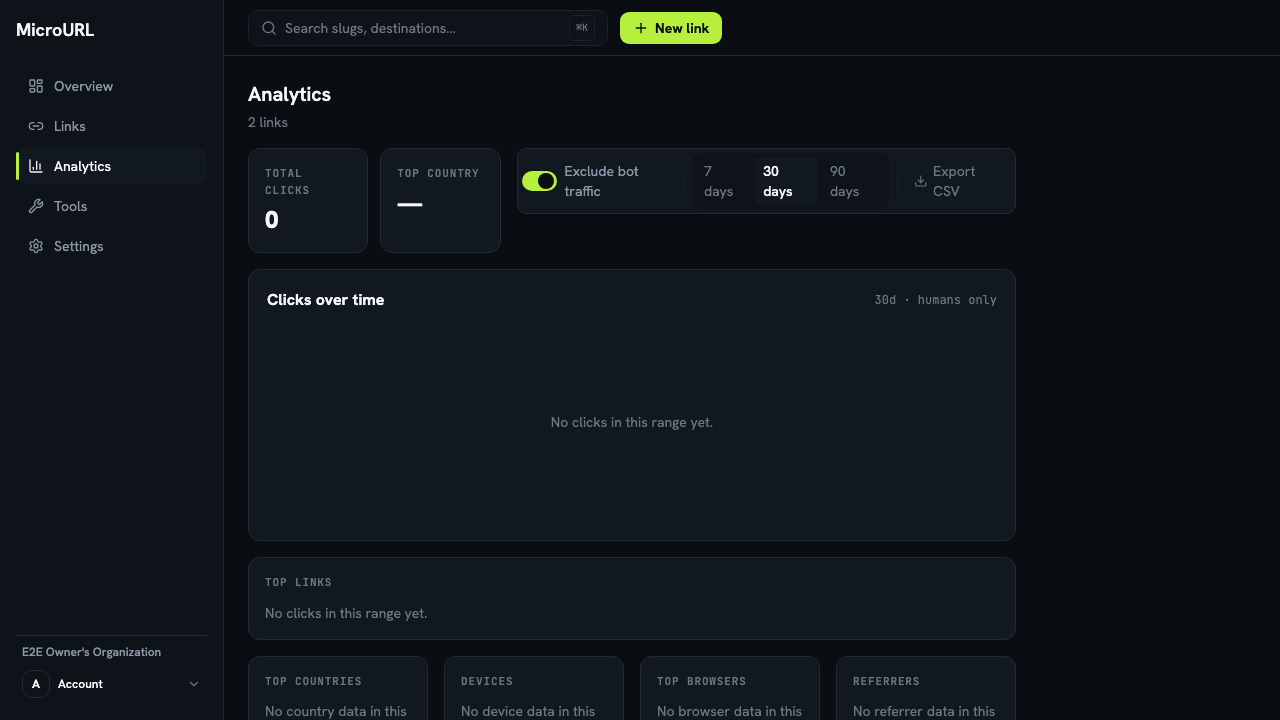
Open Analytics
Analytics in the sidebar shows your whole workspace. Any individual link’s Detail page has its own Analytics tab scoped to just that link, using the same layout.
2
Filter by date range and bot traffic
Choose 7 days, 30 days, or 90 days. Exclude bot traffic is on by default, filtering out known crawlers so your numbers reflect real visitors.
3
Read the breakdowns
Clicks over time is a daily chart for the selected range. Top links ranks your links by clicks (workspace view only). Countries, Browsers, Referrer domains, and Devices each break down the same click data a different way.
4
Export what you see
Need this data in a spreadsheet? See Exporting analytics to CSV.